Impact of Location and Optimization on Maximizing BESS Revenue
Author: Marc Alvarez, Business Development Analyst, Gridmatic
This blog post dives into battery energy storage system (BESS) revenue and the key factors that influence it: location and optimization.
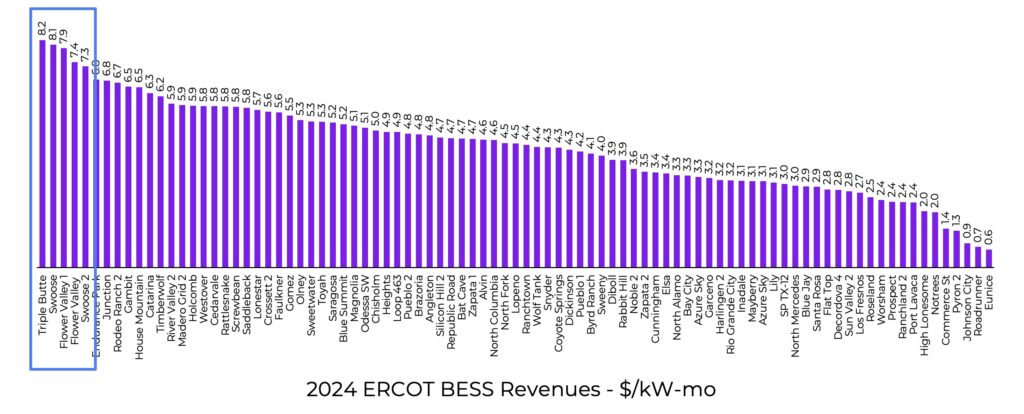
This analysis includes the 89 batteries in ERCOT that operated for the full 2024 calendar year. Nearly 60 utility-scale batteries have been added since the start of 2024, but this full-year dataset offers a solid foundation for understanding performance trends.
Looking at the top five revenue-generating batteries, all are located in Far West Texas—an area southwest of Midland which experienced the highest congestion in ERCOT during 2024. This clearly highlights the importance of location, but (spoiler alert!) it’s not the entire story.
Zone matters, but it’s not everything
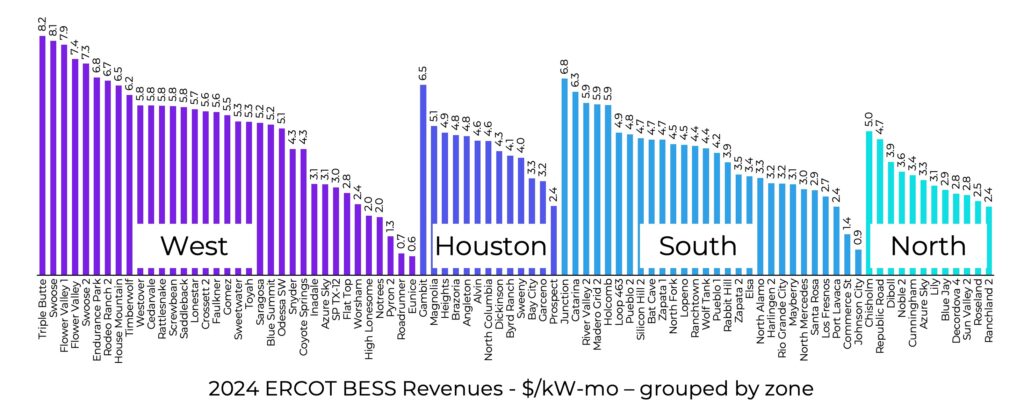
The above graph shows the same 89 batteries, now sorted by revenue and grouped by ERCOT load zone. As you can see, there are high and low performers in every zone. While the West zone offered the highest revenue opportunity due to intra-day price differences and systemic congestion, it also had underperformers. Similarly, in the remaining zones, performance varied widely.
Some of this variation is due to intra-zonal congestion and differences in battery duration. However, much of the difference can be attributed to the wide variety in bid optimization strategy taken by the respective battery operators.
To dive in deeper, we need to isolate optimization performance from the underlying locational value.
Isolating location from optimization
To better separate the impact of operator performance from location, we use a top-bottom (TB) revenue spread as a baseline to normalize BESS performance.
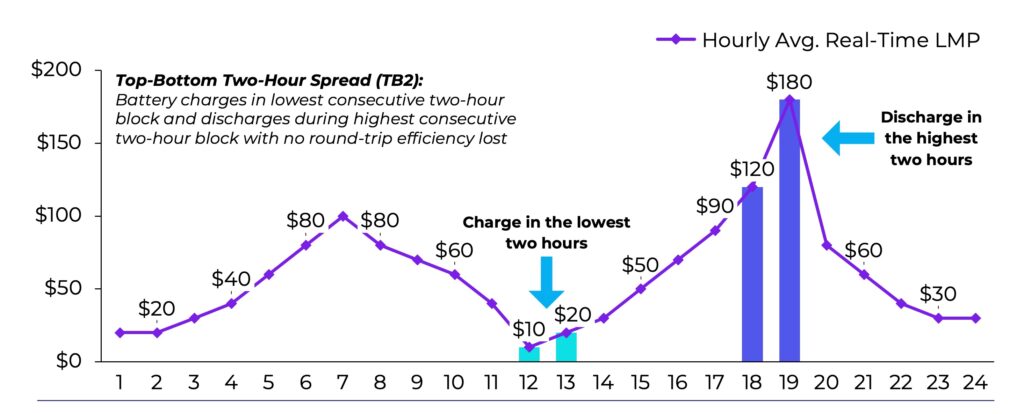
We start with a simple revenue strategy baseline that is specific to each battery location: charging at the lowest priced two hours of the day and discharging at the highest price two hours. We then compare each battery’s actual revenue to this baseline that captures the locational opportunity unique to the battery site.
To do this, we group batteries by duration, and then calculate the real-time top-bottom spread by duration. This chart illustrates the concept for a 2-hour battery, where the dots on the line represent hourly average RT prices, and the bars show the cost of charging and the revenue from discharging respectively, during the highest and lowest hourly prices.
This baseline has some limitations. Batteries are categorized into either one or two hour duration groups based on their current estimated energy capacity. Additionally, the baseline does not account for ancillary services, day-ahead energy, or efficiency losses. However, as real-time energy arbitrage makes up more and more of the battery revenue stack, we believe that top-bottom spreads are the most meaningful benchmark. But because the majority of BESS energy revenue in ERCOT comes from real-time energy markets, we believe this is the most meaningful benchmark.
Baseline opportunity varies by location
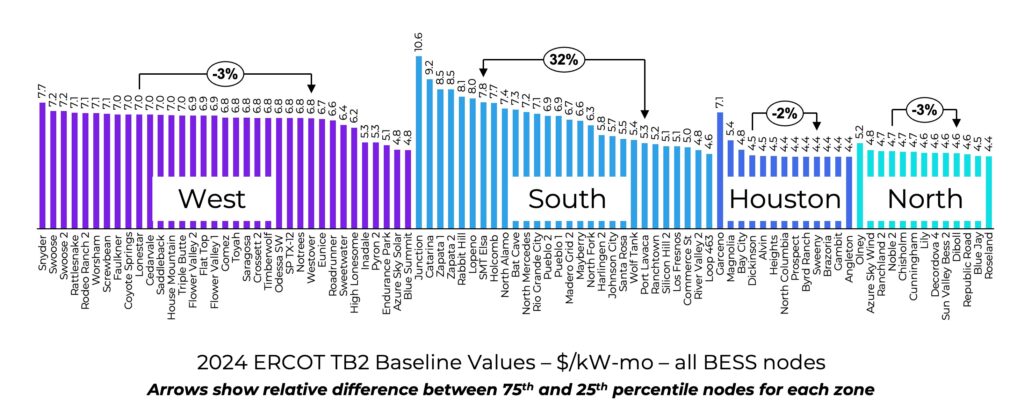
This chart again ranks batteries by revenue and zone, but now it shows TB2 baseline values rather than actual revenue. While this includes both one and 2-hour batteries (we’ll normalize for that later), it highlights how revenue opportunity varies by region.
The West and South zones show the highest baseline values, with the South zone displaying significant variation. In most zones, the difference between the 75th and 25th percentile nodes is insignificant at 2-3%. However, in the South, it’s 32% showcasing the large differences in locational values even within the same zone.
Upon further inspection, we found that many of the highest value locations in the South are 9.9 MW distribution-connected batteries in very congested low-voltage areas. In the West, many batteries are in Far West Texas, where congestion was consistently high. There aren’t as many batteries built in the remainder of the West zone, such as the Texas Panhandle, where the TB2 spreads are lower. The other two load zone regions, Houston and North, had lower TB2 spread opportunities in 2024, reflecting less intra-day price variation and congestion.
The best-performing location measured by TB baseline can change year to year
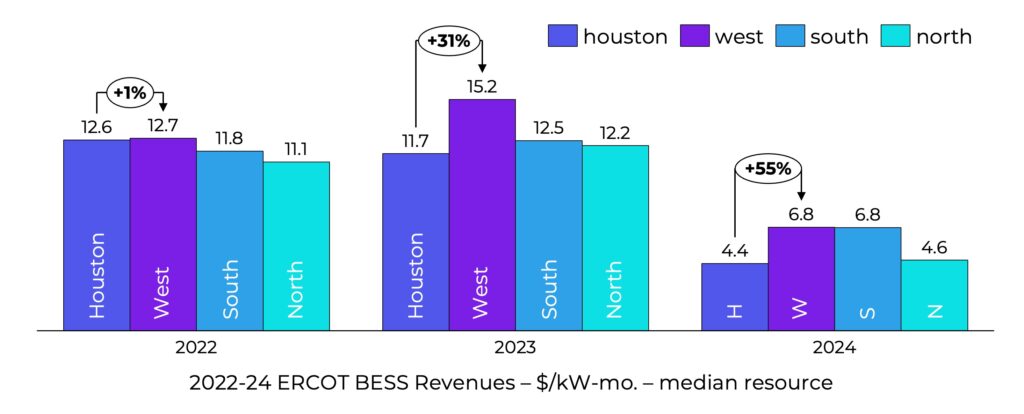
Looking at median battery revenue by zone for 2022, 2023, and 2024 shows that the best zone for locational value shifts year to year. In 2022, Houston and West zones were most valuable. But in 2023 and 2024, Houston became the least valuable, while West retained its relative position. For project development analysis, a backward looking view of volatility is insufficient. Changes to generation and load on the grid, as well as changes to grid topology, all impact congestion patterns over time. It is critical to forecast these changes into the future to site batteries in top performing locations.
Evaluating optimization using TB2 performance
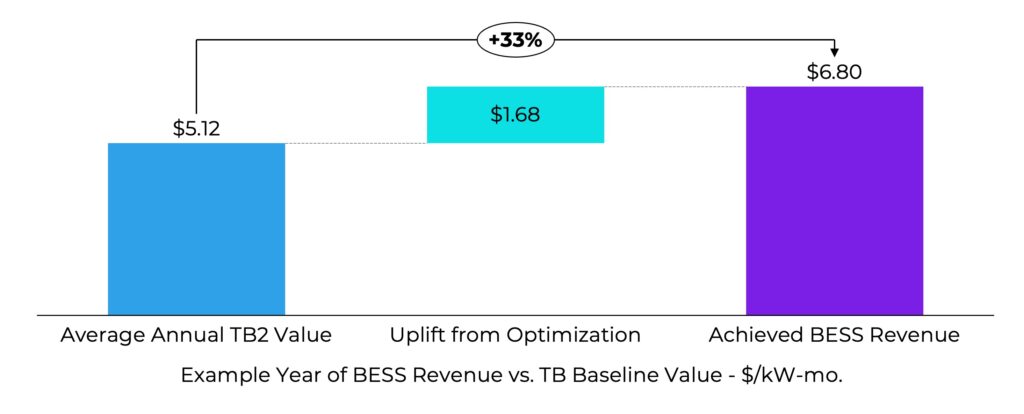
To assess optimization, we look at the percent of uplift over a TB baseline for each battery, which is simply calculated by dividing the actual system revenue by the specific locational TB2 baseline value. For example, if a battery earns $6.80/kW-month with a TB2 baseline of $5.12/kW-month, the uplift is 33%. In many cases the value is negative because the battery revenue underperforms the locational baseline.
1-hour BESS can achieve higher uplift over their TB baseline than 2-hour BESS
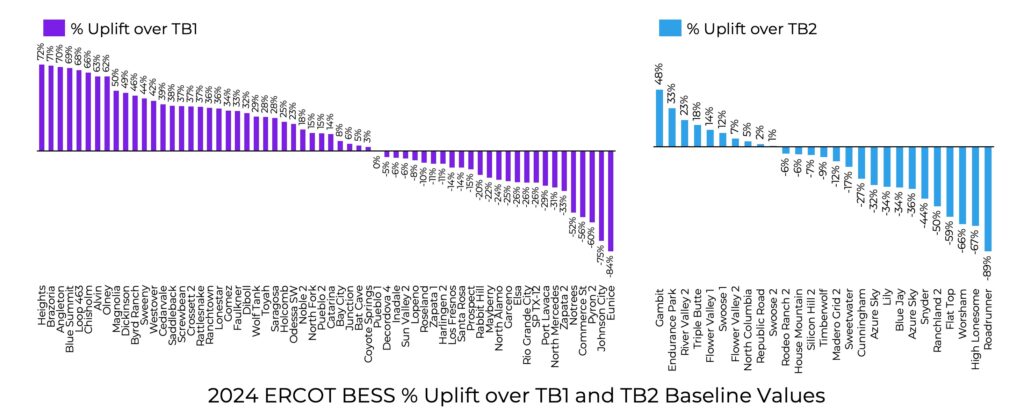
This chart compares TB1 and TB2 uplift across all 1-hour and 2-hour batteries. Note that the TB1 tends to show more positive uplift, because the ancillary service revenue that a 1-hour battery achieves relative to the TB1 baseline is higher than the ancillary service revenue a 2-hour battery can achieve relative to the TB2 baseline. As a result, 1-hour and 2-hour BESS aren’t directly comparable on uplift. But within each duration group, performance varies widely.
1-hour BESS earn less of their revenue from energy arbitrage than 2-hour BESS
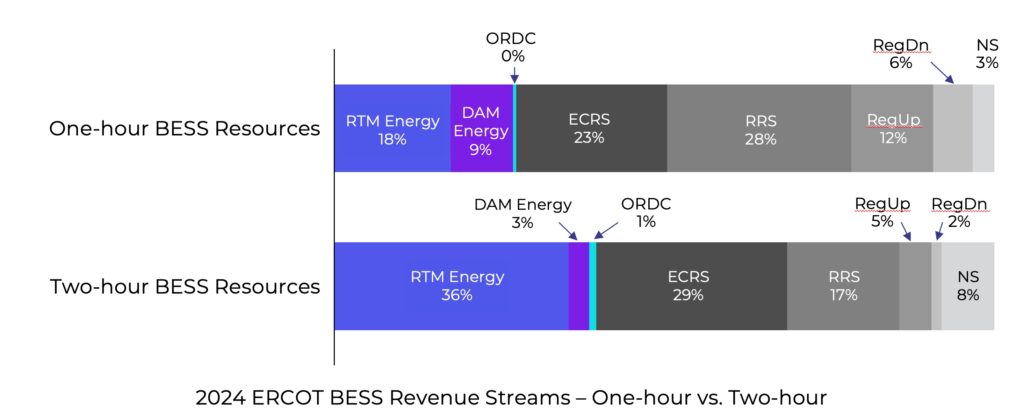
This graph shows the difference in strategy between 1-hour and 2-hour batteries. Across 1-hour batteries, less than 30% of system revenue came from energy arbitrage, but for 2-hour batteries, more than 40% of revenue came from energy arbitrage.
The TB2 baseline chart allows us to evaluate optimization performance relative to location
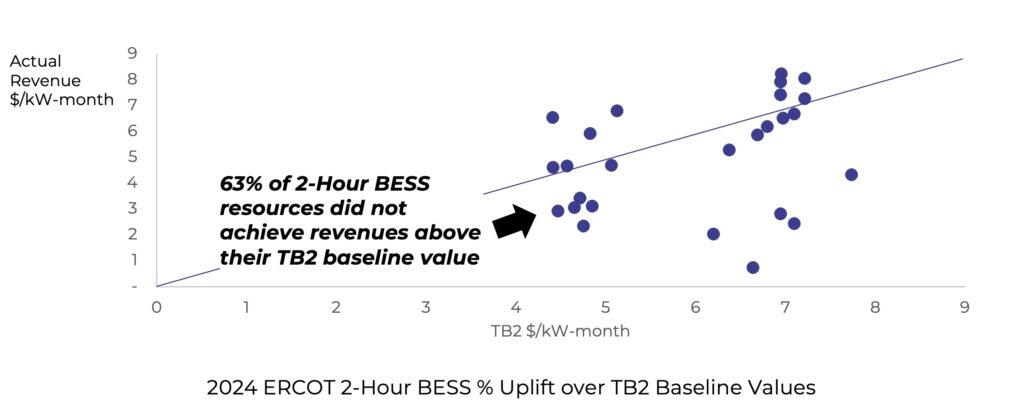
Zooming in on the 2-hour batteries, we can use the TB2 baseline to evaluate the performance from the respective operators’ bid optimization relative to location.
We plot the location-specific TB2 baseline for each battery (X-axis) against the actual system revenue achieved in 2024 (Y-axis).
As seen above, some batteries significantly exceed their baseline; but the majority fall short. This implies that battery operators are leaving revenue on the table through poor bid optimization.
The TB2 baseline shows the relative impacts of location …
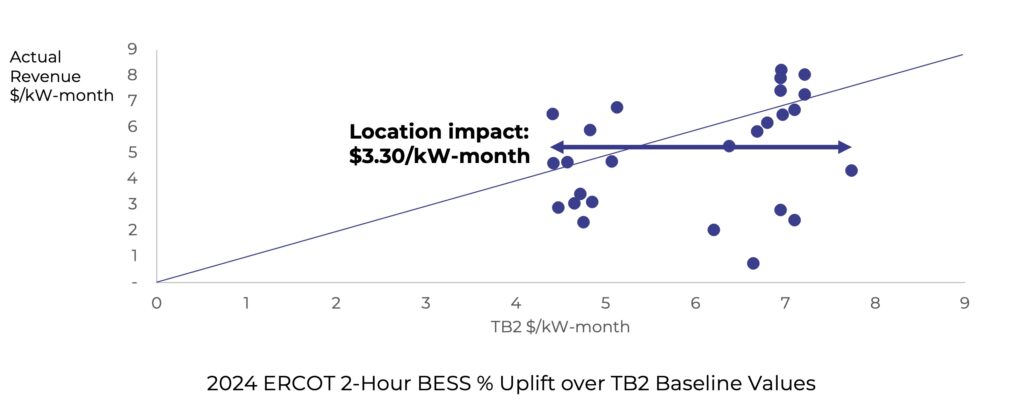
Plotting actual system revenue against the locational TB2 baseline can demonstrate the amount of revenue attributable to both location selection and bid optimization. Comparing batteries in the left and right cluster shows that systems TB2 baseline differed by over $3.30/kW-month across systems, showing the locational difference between better and worse nodes for storage.
… and performance
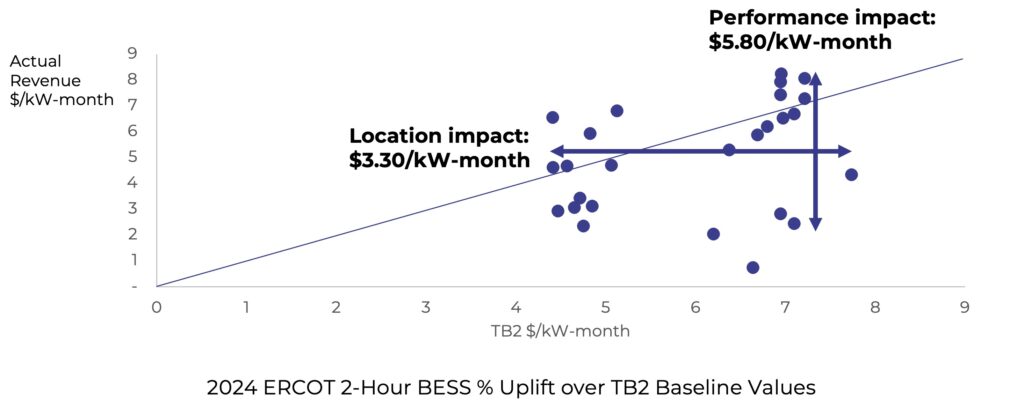
Using the same approach we can isolate the difference in actual revenue between batteries with the same locational TB2 value. Looking at the right cluster shows that there are batteries with similar locational values but with actual revenue that differed more than $5.80/kW-month. Choosing a great location is not sufficient for battery operators, the right bid optimization strategy is necessary to achieve high revenue performance.
Optimizers can be evaluated based on their performance relative to the locational baseline
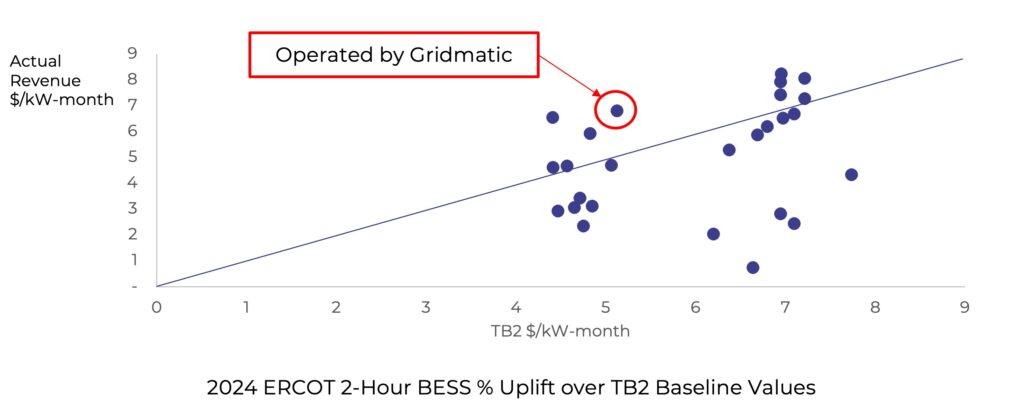
The best way to assess an optimizer is by comparing their actual project performance against the relevant TB baseline. It’s the best measure for operational success.
In our own case, a battery we operated for all of 2024 ranked 6th in total revenue, but 2nd in TB2 performance. The performance represents a 48% revenue uplift over the weighted average BESS revenue in ERCOT, and illustrates the impact of AI-powered optimization for maximizing battery storage returns, regardless of location.
Whether you pick a great node or you pick a poor node, the value of advanced forecasting and optimization has a significant impact on battery revenue. Even at great locations, system revenue depends heavily on how well a battery is optimized.