Differences in battery participation in the CAISO and ERCOT markets
Authors:
David Miller, Chief Commercial Officer, Gridmatic
Mia Nakajima, Data Scientist, Gridmatic
This blog post explores the differences in battery participation between these two markets, focusing on how varying market rules and the distinct role of the Day Ahead Energy product shape revenue opportunities for storage assets.
Source: Voltility, Nov 2024
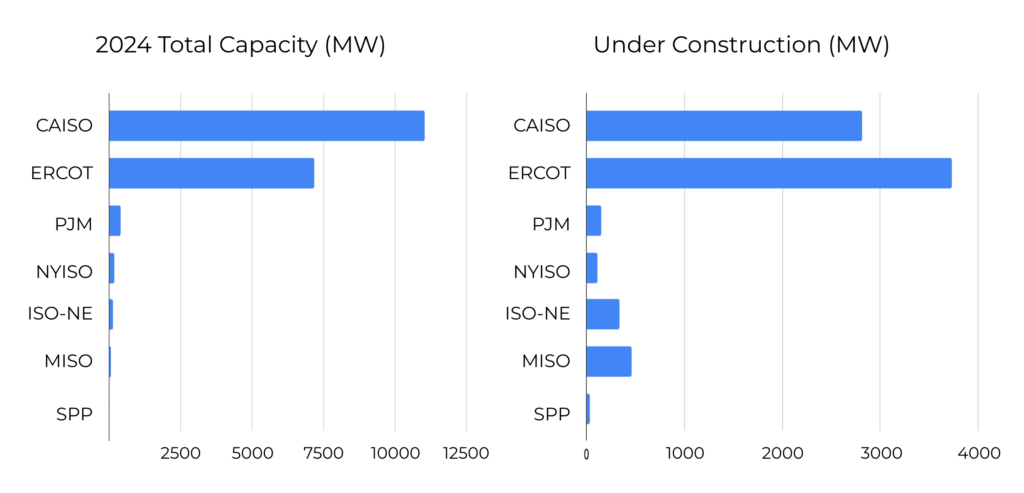
CAISO and ERCOT are the two largest ISOs for installed storage capacity as shown in the left graph. They are also the leading ISOs for projects under construction as indicated in the right graph, suggesting that these will continue to dominate wholesale markets for storage in the near future. Note that the third largest market is non-ISO, primarily WECC, but in these regions, vertically integrated utilities handle dispatch, making it less relevant for this discussion.
Revenue Sources
Source: Representative ERCOT and CAISO resources, Summer 2023
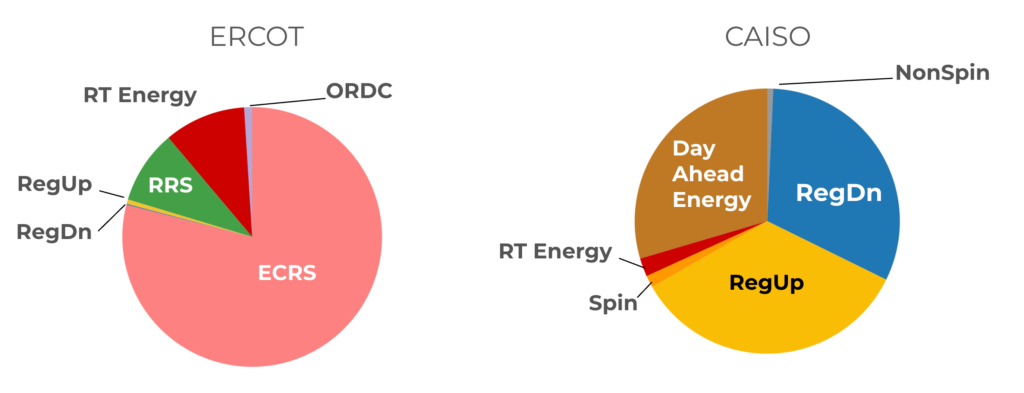
These graphs compare revenue differences between the two ISOs regarding market products, illustrating the impact of differing market rules and the role of the Day Ahead Energy product. CAISO’s Day Ahead market creates significant Day-Ahead Energy revenue opportunities, whereas ERCOT relies more on ancillary services with less emphasis on Day Ahead Energy participation to date.
The pie charts show the revenue mix for two representative systems that Gridmatic has been involved in within each market. We picked 2023 as the time period to examine as a baseline because some of the trends we’ll discuss are relative to the 2023 baseline, although many changes have occurred in 2024.
Both markets share similarities in their revenue streams, heavily emphasizing ancillary services. In ERCOT, ECRS was a major revenue driver during 2023, partly due to high prices as it was a newly introduced product with limited supply. Other ancillary services such as RRS, RegUp, and RegDn also played a role, with Real-Time Energy settlement making up just under 15%. ERCOT didn’t have significant Day-Ahead Energy revenue. In contrast, in CAISO, ancillary services prices were lower, but RegUp and RegDn still contributed significantly. Day-Ahead Energy accounted for around 30% of the revenue, whereas Real-Time Energy was a smaller portion.
Since 2023, both markets have seen a shift towards more energy revenue, and we will delve into how this happened. The first factor, which we’ll discuss next, is ancillary service market saturation. Ancillary service saturation refers to ancillary service price reduction due to the lower marginal costs of energy storage resources rather than the higher marginal costs of traditional providers of ancillary services, most commonly gas-fired generation.
Storage Buildout
Sources: ERCOT and CAISO
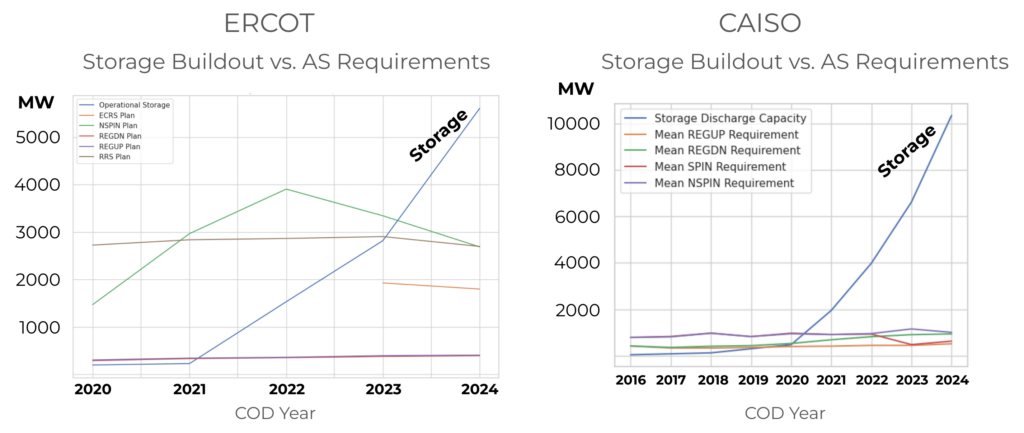
These charts illustrate the buildout of storage over time, measured in MW, compared to the average procurement requirements for ancillary services. These requirements, set by the ISOs, vary based on reliability metrics and allocation methodologies for different services.
In ERCOT (left graph), the addition of ECRS (orange line) in 2023 led to a reduction in NonSpin (green line) but still resulted in a net increase in ancillary services. This, along with increased demand and a hot summer, led to ancillary saturation not occurring in 2023 as many people had predicted in 2022. In CAISO (right graph), storage capacity far exceeds ancillary services procurement needs. Although one might expect ancillary services prices to have dropped to the marginal cost of battery dispatch by 2022, we still observed meaningful revenue opportunities in 2023 and even into 2024. That said, as storage buildout continues to grow, we are seeing ancillary services saturation occurring more fully in 2024.
Regional Differences
Source: CAISO
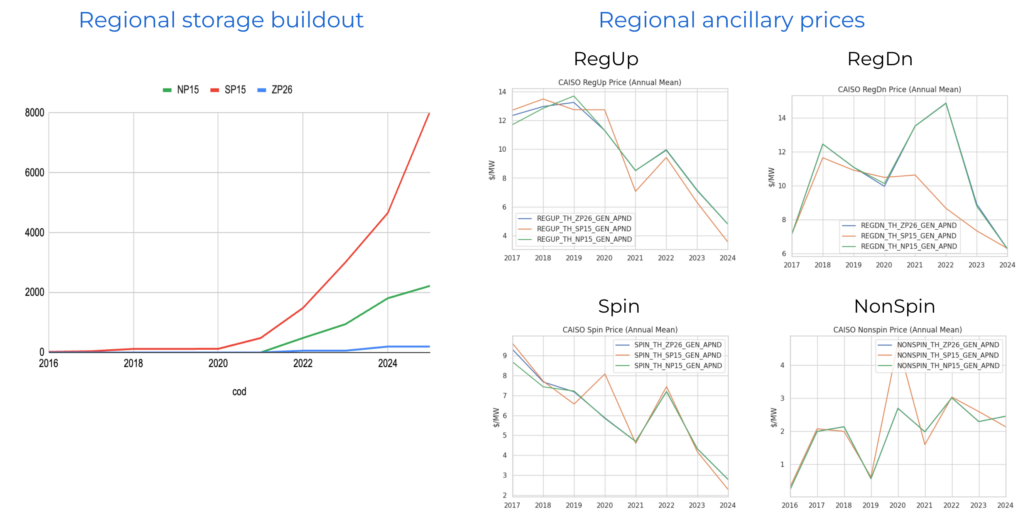
There are several reasons for the differences in ancillary service price saturation in CAISO, one of which is regional nuances. In ERCOT, ancillary services are procured systemwide, while CAISO factors in intra-CAISO transmission constraints and procures ancillaries zonally. Storage buildout in California has predominantly occurred in SP15 (Southern California). This may be contributing to regional price discrepancies, particularly in RegDn, where prices started to decrease earlier in SP15 compared to the other two regions.
__________________________________________________
Factors in CAISO Impacting Day-Ahead Energy Participation
There are 4 factors that affect day ahead energy participation from battery storage resources in CAISO:
1. Resource adequacy obligations
Storage resources with a resource adequacy contract (which includes most of them) are required to bid into the Day-Ahead Energy market. They can use economic bids to control dispatch but must submit an energy offer curve, which introduces some limitations.
2. Default Energy Bid (DEB) requirement
The DEB rule can complicate economic bidding for storage. DEB aims to estimate cost-based bids, preventing generators from submitting excessive bids to manipulate prices. While more straightforward for thermal generators (due to transparent fuel costs), it’s complex for storage where electricity serves as fuel and opportunity costs are high. As a result, DEB for storage in CAISO is imperfect. For example, for a 4-hour battery, DEB is based on the fourth-highest Day-Ahead market price, multiplied by a factor. This can lead to challenges when Day-Ahead prices are low but higher prices are expected in the real-time market. If the bid exceeds the DEB, CAISO may mitigate it, lowering the bid value and making state of charge management difficult.
3. Ancillary SOC requirements
CAISO also has specific rules for ancillary services that impact Day-Ahead Energy. Unlike ERCOT, where cleared ancillary services are the responsibility of the battery, CAISO only clears ancillary service awards if it expects the battery to meet state of charge (SOC) requirements later in the day. This means storage operators must optimize for both what CAISO expects to happen and what they believe will actually happen, making Day-Ahead awards critical for ancillary revenue in CAISO, unlike ERCOT.
4. Opportunity costs
Lastly, opportunity cost plays a role in both CAISO and ERCOT. Bidding in the Day-Ahead market means sacrificing potential real-time opportunities, which always carry a chance of price spikes. In the Real-Time market, that opportunity (to bid into the DAM) no longer exists, meaning the cost is simply idling. This distinction significantly affects bidding strategy in both markets.
__________________________________________________
Day Ahead Energy Participation
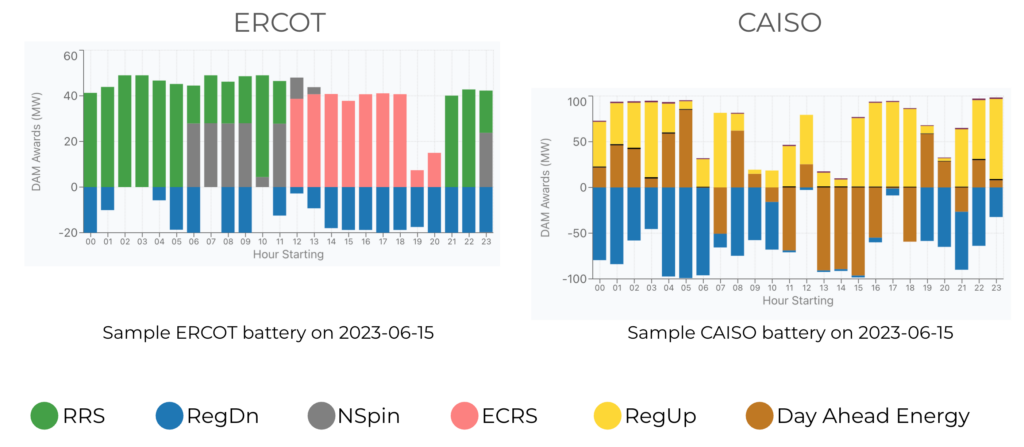
The graphs above illustrate Day-Ahead Energy differences. These are the same two resources examined in the pie charts above, but looking at the Day-Ahead energy and ancillary services awards for a single day.
A significant portion of the CAISO battery’s revenue comes from Day-Ahead Energy, whereas it remains relatively small in ERCOT. Several factors contribute to this difference, including obligations for storage resources with resource adequacy contracts, Default Energy Bid (DEB) complexities, and CAISO’s methods of awarding ancillary services based on State of Charge (SOC) expectations.
Comparing individual systems in ERCOT and CAISO, we see that ERCOT batteries primarily rely on ancillary services throughout the day, while CAISO batteries need Day-Ahead Energy to ensure they are cleared for higher-value RegUp and RegDn awards.
CAISO Day Ahead Market Bidding
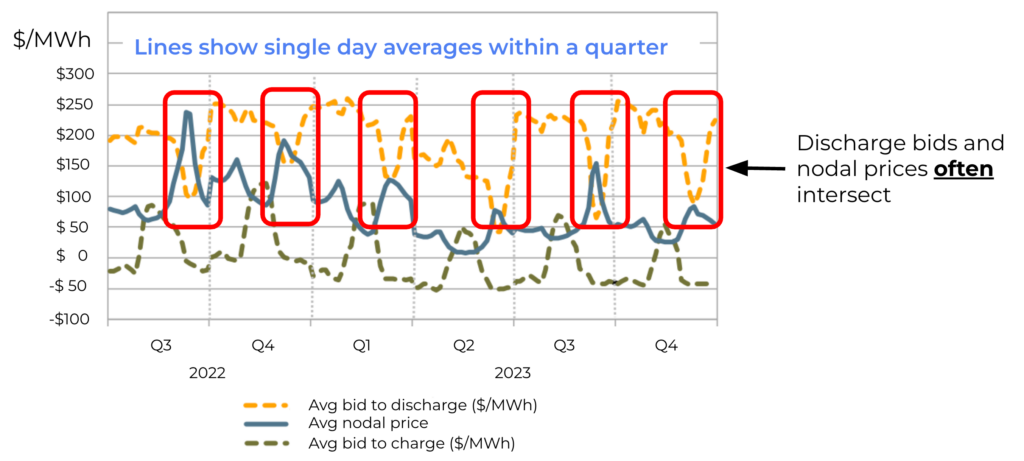
Source: CAISO 2023 Special Report on Battery Storage
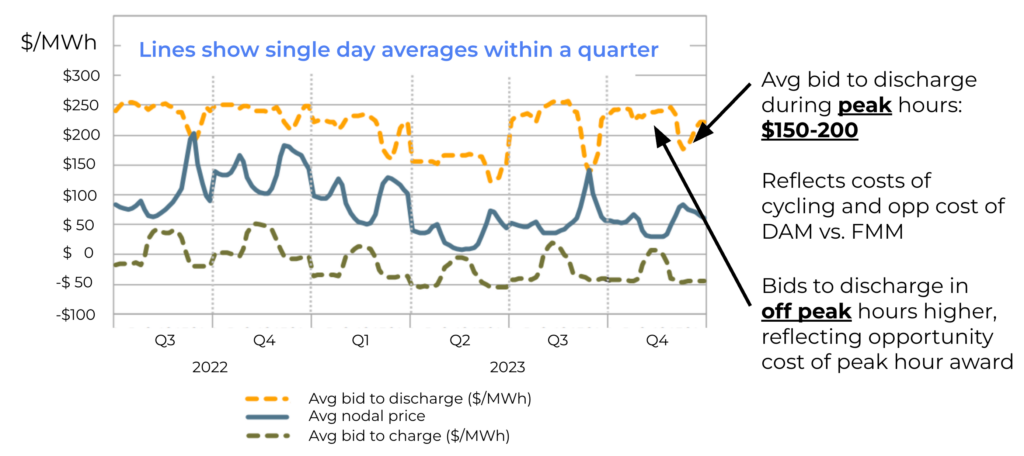
Finally, the CAISO Day-Ahead bidding landscape shows interesting patterns. The chart shows the battery fleet-wide average values for a 24-hour period within each quarter. The first thing to note is that bids to discharge drop during the evening peak period. What’s happening here? Batteries are strategically using economic bids to avoid discharge during most hours except when peak prices make it worthwhile. During these peak periods, the price to discharge ranges from $150 to $200 per MW. Conversely, the highest prices to charge occur in the middle of the day when batteries expect prices to be lowest, making it an ideal time to charge.
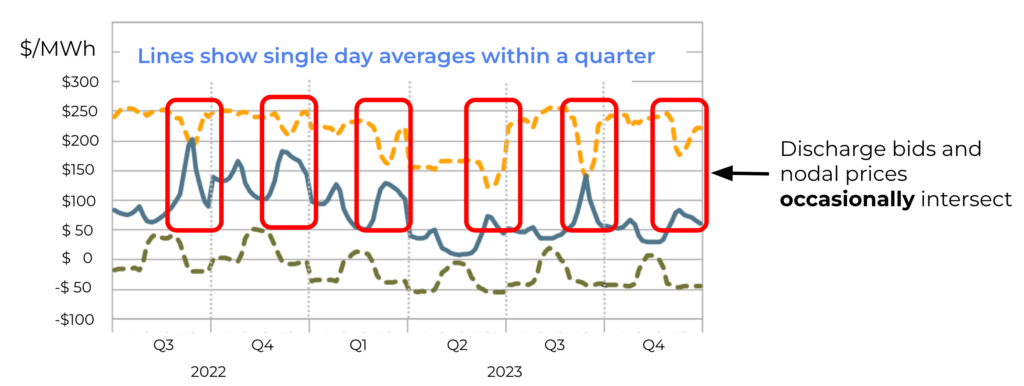
Where the charge and discharge lines intersect, this indicates the marginal price at which the average battery is cleared to either charge or discharge. Highlighting these intersections in the evening shows that discharge bids do occasionally overlap, leading to mixed behaviors where some batteries clear in the DAM while others do not.
FMM Market
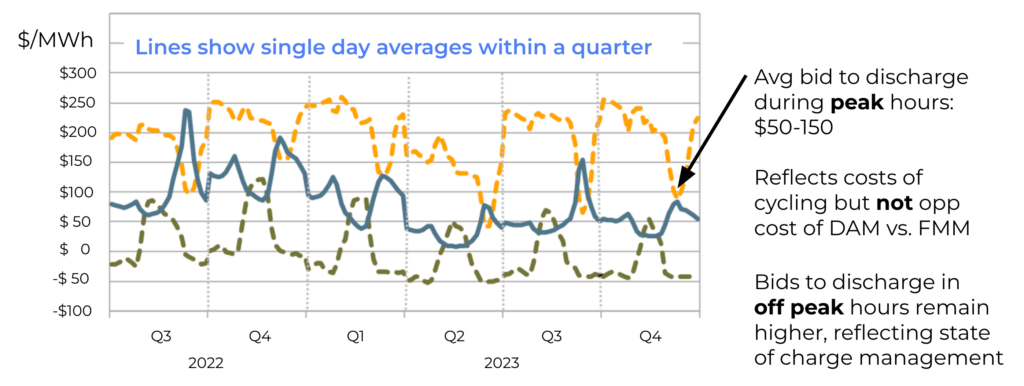
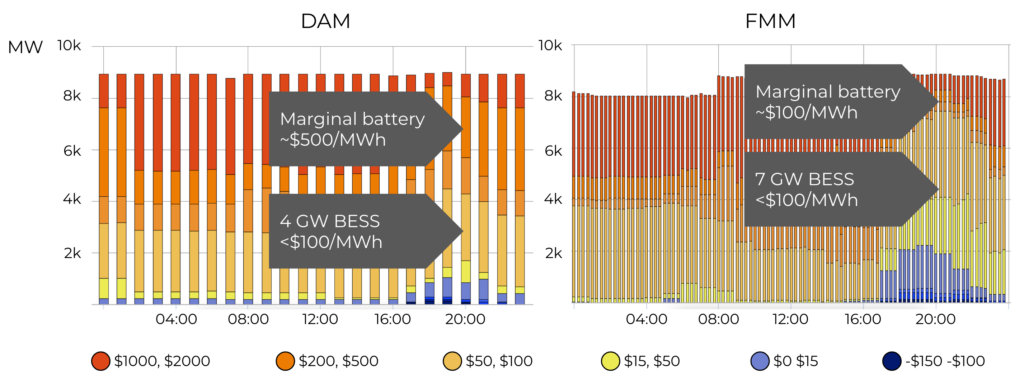
In the Fifteen Minute Market (FMM), the charts show similar patterns for discharge and charge bids but in a more pronounced way. The average bid to discharge during peak hours has decreased to $50-100/MW. Unlike in the DAM, these batteries do not face opportunity costs of providing more valuable services, making them willing to discharge at a lower price in the FMM.
Examining the evening period, average bid prices often intersect average prices, indicating that batteries frequently clear a significant amount of capacity as a fleet for charging and discharging in the FMM.
Source: CAISO Daily Energy Storage Report
Let’s zoom in on a single day to examine battery behavior in more detail using CAISO data.
During hour 20, the arrows on the chart highlight key differences between DAM and FMM bidding. In DAM, 4 GW of capacity bid below $100/MW, while the 7th GW priced around $500/MW. In contrast, in FMM, 7 GW of capacity bid below $100/MW, with the marginal battery also around $100/MW. The DAM price was around $500, compared to $100 in FMM, showing significant differences due to varying opportunity costs.
These differences indicate structural factors leading to distinct bidding behavior in DAM and FMM. On this day, it made sense for some batteries to bid in DAM, but these dynamics can shift, possibly leading to price spikes or shifts in delivery to FMM. To maximize revenue, forecasting behavior is crucial, especially given the dynamic nature of battery interactions between DAM and FMM. CAISO is the first US ISO demonstrating the impact that battery storage will have in setting marginal energy prices in both the DAM and FMM, a new dynamic that market participants need to incorporate into their decisions. Advanced forecasting is key to understanding and optimizing this behavior.
ERCOT Storage Setting Energy Prices
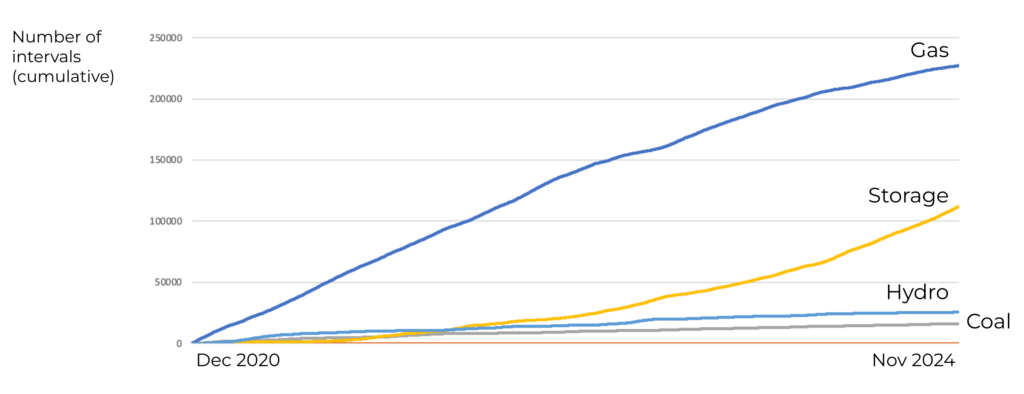
Turning to ERCOT, we are beginning to see similar trends. In 2023, 85% of battery revenue came from ancillary services. By 2024, this has shifted, with most batteries now active in both the Real Time Market (RTM) and DAM. The chart shows that battery storage is increasingly setting the marginal price in ERCOT’s RTM, with 55% of RTM intervals set by batteries in 2024. As battery capacity continues to grow, we expect increased DAM participation. We expect that ERCOT will see some of the same dynamics as CAISO, with energy storage setting marginal energy prices in the DAM and RTM.
Conclusions
- ERCOT has followed CAISO in ancillary service pricing, though the trend has been inconsistent due to regional procurement differences and new products. This trend is likely to continue.
- CAISO batteries are significantly impacting the energy market, and we expect similar impacts to emerge in ERCOT moving forward.
- As batteries play unique roles in both Day Ahead and Real Time markets, their bidding strategies will be crucial for maximizing revenue and influencing other market participants.
Key takeaway: Optimal storage market participation will require advanced forecasting of both DAM and Real Time markets to determine the best opportunities for Day Ahead participation.
Gridmatic Forecasting
Cumulative profit in Day Ahead Energy trading
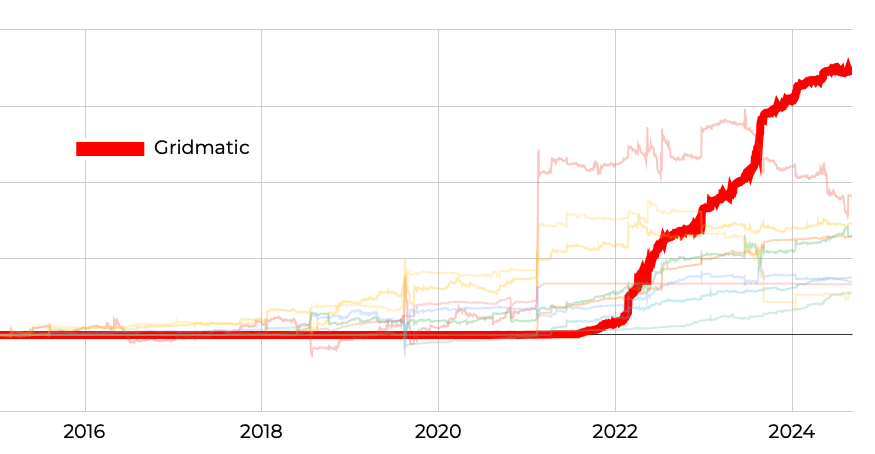
The topic of this blog is central to what we do. As a financial trader and battery optimizer, we excel in the Day-Ahead market across ISOs. Our success in ERCOT is evidenced by public data, showing us as the most profitable Day-Ahead Energy trader over the past decade. Our AI forecasts help optimize storage performance, leading to significant revenue gains. We offer multiple business models, including fixed monthly payments, revenue sharing, and bid optimization services to help battery owners maximize returns.